
It looks like an exploding star, but it's actually a way of visualising mathematical problems

An Imperial engineering student showcases his equations as a set of beautiful diagrams and describes how they can be used to optimise processes.
Immerse yourself in the slideshow below and scroll through some of the diagrams developed by Andrea Picciau.


Optimisation is a field of research that is used by engineers to reconfigure processes so that they function more efficiently and effectively. For example, by optimising the processes that run a power plant it could lead to savings in the energy used to generate electricity and reductions in running costs, which could be passed on as savings to customers. The field is interdisciplinary involving researchers from mathematics, computer science and engineering.
Andrea Picciau is a research postgraduate from the Department of Electrical and Electronic Engineering at Imperial. His work shows how the mathematical problems that need to be solved to optimise processes can be described in forms other than the language of algebra.
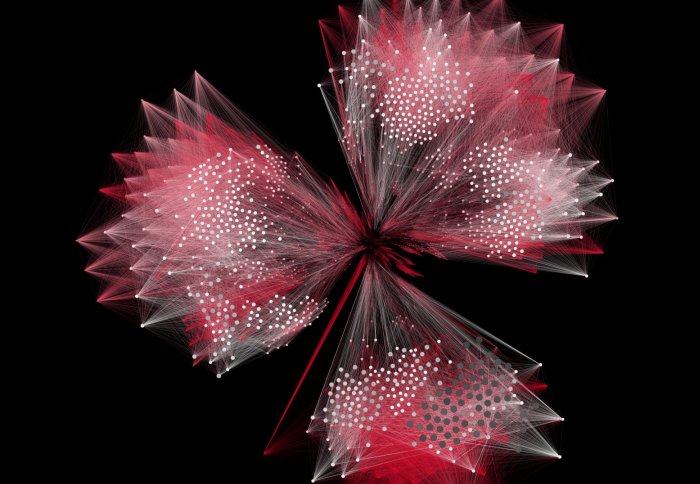
The diagrams in the slideshow below are visual representations of a theoretical problem in energy management, which could be used to make a building more efficient. The blobs represent theoretical “switches” and “knobs” that are turned on in processes to do with energy consumption. The lines represent the interconnectedness between processes. Regions on the periphery of the diagrams show processes that are less connected and therefore are less useful for saving energy.
Picciau explains: “All the diagrams in in the slideshow concern the same problem, which is about finding the best configuration of a power system in a building that is energy smart. The aim is to find ways to make the building even more energy efficient. You could think of every image as if it was a frame in a video. If you sped up each frame, you’d see blobs merging into bigger ones, others splitting up, smaller regions becoming brighter in colour and so on, until at the end you are left with the final image that shows how the problem has been solved.”
Article text (excluding photos or graphics) available under an Attribution-NonCommercial-ShareAlike Creative Commons license.
Photos and graphics subject to third party copyright used with permission or © Imperial College London.
Reporter
Colin Smith
Communications and Public Affairs
Contact details
Email: press.office@imperial.ac.uk
Show all stories by this author


Leave a comment
Your comment may be published, displaying your name as you provide it, unless you request otherwise. Your contact details will never be published.